雅思写作小作文之柱状图详解
2016-08-30编辑: 环球雅思来自:
雅思写作小作文之柱状图详解,小作文一般都是图表作文,常见的类型主要有表格图、曲线图、柱状图、饼状图和画图题,虽然种类比较多,但是每个题型都有自己的规律,小编给大家搜集了雅思写作小作文题型的详细内容希望能够给大家带来帮助!
从雅思写作小作文历年题型来看柱图和线图是每月常考的题型,有时候可能会有连考或者是交替考的趋势,饼图和表格题也是相对频率较高的题型,画图题则是围绕在流程图或者是地图题上面,不论考取哪一种题型,要求都是一样的。经常在考试的时候图表看懂了但是数据比较凌乱,找不出明显的特征,或者是找到了特诊但是不知道用什么样的思路来把它描述的清楚一些。
一般情况下单柱子的小作文试题比较简单,主要是分析一下横纵轴上的内容即可,如果是以时间为横轴的话,主要是写纵轴上的趋势,如果是以组为横轴,那就直接进行对柱子进行描述即可。
但是多数情况下雅思小作文柱状图是以多柱子的形式出现的,这个时候就要针对横纵轴之间的对应关系逐个分析。如果柱子的个数比较少的时候可以全部分析,但是要是柱子的个数比较多的情况下就要着重找几个柱子进行分析。
雅思写作小作文范文分享:
1. The chart and graph below give information about sales and share
prices for Coca-Cola.
Write a report for a university lecturer describing the information shown
below.
· You should write at least 150 words.
· You should spend about 20 minutes on this task.

Model answer:
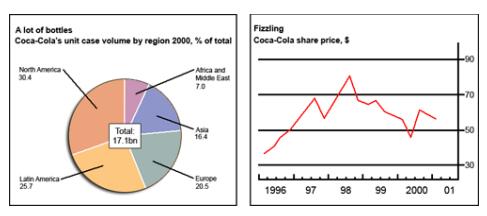
The pie chart shows the worldwide distribution of sales of Coca-Cola in the
year 2000 and the graph shows the change in share prices between 1996 and
2001.
In the year 2000, Coca-Cola sold a total of 17.1 billion cases of their fizzy drink
product worldwide. The largest consumer was North America, where 30.4 per
cent of the total volume was purchased. The second largest consumer was
Latin America. Europe and Asia purchased 20.5 and 16.4 per cent of the total
volume respectively, while Africa and the Middle East remained fairly small
consumers at 7 per cent of the total volume of sales.
Since 1996, share prices for Coca-Cola have fluctuated. In that year, shares
were valued at approximately $35. Between 1996 and 1997, however, prices
rose significantly to $70 per share. They dipped a little in mid-1997 and then
peaked at $80 per share in mid-98. From then until 2000 their value fell
consistently but there was a slight rise in mid-2000.
2. The chart below gives information about global sales of games
software, CDs and DVD or video.
Write a report for a university lecturer describing the information.
· You should write at least 150 words.
· You should spend about 20 minutes on this task.

Model answer:
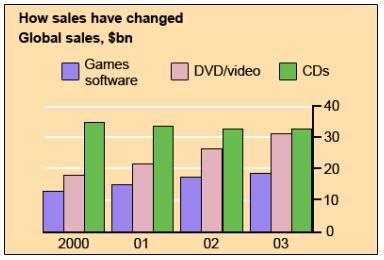
The chart shows the changes in the sales of video material / DVDs, games
software and CDs around the world in billions of dollars over a three-year
period. It can be seen that the sales of videos / DVDs and games software
have increased, while the sales of CDs have gone down slightly.
Between 2000 and 2003, the sale of videos and DVDs rose by approximately
13 billion dollars. In 2000, just under 20 billion dollars worth of these items
were sold, but in 2003, this figure had risen to a little over 30 billion dollars.
The sales of games software also rose during this period, but less sharply.
Sales increased from about 13 billion dollars in 2000 to just under 20 billion
dollars three years later. By contrast, during the same time period, the sale of
CDs fell from 35 billion dollars in 2000 to about 32.5 billion dollars in 2003.
3. The graphs below show the types of music albums purchased by
people in Britain according to s3x and age.
Write a report for a university lecturer describing the information shown
below.
· You should write at least 150 words.
· You should spend about 20 minutes on this task.


Model answer:
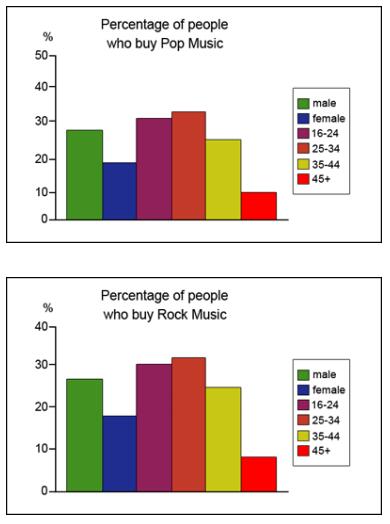
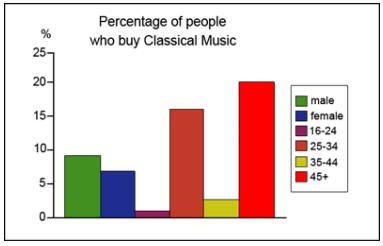
The three graphs provide an overview of the types of music people purchase in
the UK. At first glance we see that classical music is far less popular than pop
or rock music.
While slightly more women than men buy pop music, the rock market is
dominated by men with 30% buying rock, compared to 17% of women. From
the first graph we see that interest in pop music is steady from age 16 to 44
with 20% of the population continuing to buy pop CDs after the age of 45.
The interest in rock music reaches its peak among the 25 to 34 year olds,
though it never sells as well as pop. Interest also drops off after the age of 35
with an even sharper fall from age 45 onwards, a pattern which is the opposite
to the classical music graph.
雅思写作小作文之柱状图详解的详细内容就是这些,包括了详细的范文以及写作技巧和注意点,希望对雅思考试有所帮助,更多雅思最新资讯请继续关注环球教育雅思频道。
热门推荐:

相关阅读

-
预约雅思水平在线测试
获取0元体验课程


